Exposing Custom Performance Metrics to ANTS Profiler 5
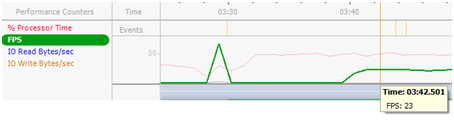
Redgate ANTS Profiler for the .NET Framework is one of the nicest profilers I’ve ever had the pleasure of working with. However, when writing CPU-intensive applications such as games, you often find yourself wanting to locate particularly bad frames, rather than trying to find a bottleneck over the entire application. This can be tricky to do – ANTS has a CPU usage graph, but for CPU-intensive applications, this is almost always at 100% which is not very insightful. Being able to isolate expensive frames inside the profiler is incredibly useful. This post shows you how to expose your own metrics (such as FPS) to ANTS Profiler. And before we begin, a disclaimer – this uses a seemingly undocumented feature of the profiler, and I had to use Redgate Reflector to find it! I hope that in the future, they will document this and perhaps even add a GUI for adding custom counters to profile sessions. So, handle with care!
When you create a new project in ANTS Profiler, it will allow you to choose the performance counters you wish to track throughout the profile run. These are standard Windows performance counters, and so the first thing you need to do, is expose your performance counter using the Windows Performance Counter API. For .NET applications, the System.Diagnostics namespace has PerformanceCounter and PerformanceCounterCategory classes that make this pretty straightforward.
After exposing your counters via the Windows Performance Counter API, the next step is to expose these counters to ANTS Profiler. Instead of making all of the Windows Performance Counters available, ANTS Profiler just makes a known subset of these counters available for you to use during a profile run. Although undocumented, this predefined list can be extended by creating an XML file called UserCounters.xml and putting it inside the %LOCALAPPDATA%\Red Gate\ANTS Performance Profiler 5\ directory. The syntax of this XML file is as follows:
<Counters>
<Category Name="Example">
<Counter Category="Example" Name="FPS" Units="Frames/sec">
<Instanced /> <!-- Add this if your counter is instanced -->
</Counter>
</Category>
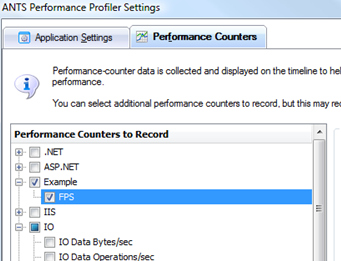
</Counters>In the “Counter” element, the “Category” and “Name” attributes must match the names of the category and counter that you have registered with the Windows Performance Counters API. Once you’ve created this file, your counter should now be visible inside the Performance Counters tab inside ANTS Profiler: