Profiling CPU Performance on Linux with 'perf'
I recently needed to profile an algorithm for cache efficiency, and in doing so, went in search of a tool that could be used to measure cache misses on Linux. In doing so, I ended up learning about the Linux Perf tools. Here are my notes.
The Linux Perf Tools provides a set of terminal-based tools for counting, sampling, and visualising both hardware and software performance events on Linux. This package of useful tools is wrapped up in a single CLI called perf.
Running perf list will display a list of all of the available events that can be measured, such as:
- cycles
- instructions
- cache-misses
- branch-misses
These events can be specified using the -e <event> argument to the majority of the other performance tools.
The perf stat command can be used to compute a running total of the number of times one or more events are triggered. This is particularly useful in gaining an overview of whether your application is generally compute bound, memory bound, stalled, etc. For example, here is the output of running Maya 2014 using perf stat --detailed -- M2014, which shows us that the majority of its startup is spent stalled in idle cycles:
Performance counter stats for 'M2014':

      25566.693274 task-clock                #    0.569 CPUs utilized
            34,946 context-switches          #    0.001 M/sec
               880 cpu-migrations            #    0.034 K/sec
           516,753 page-faults               #    0.020 M/sec
    85,686,451,343 cycles                    #    3.351 GHz                     [44.58%]
    54,287,470,519 stalled-cycles-frontend   #   63.36% frontend cycles idle    [44.68%]
   <not supported> stalled-cycles-backend
    71,136,104,503 instructions              #    0.83  insns per cycle
                                             #    0.76  stalled cycles per insn [55.80%]
    15,179,190,747 branches                  #  593.710 M/sec                   [55.65%]
       369,213,577 branch-misses             #    2.43% of all branches         [55.72%]
    20,388,868,477 L1-dcache-loads           #  797.478 M/sec                   [55.66%]
     2,585,588,655 L1-dcache-load-misses     #   12.68% of all L1-dcache hits   [55.52%]
     1,241,045,406 LLC-loads                 #   48.541 M/sec                   [44.52%]
        84,412,897 LLC-load-misses           #    6.80% of all LL-cache hits    [44.54%]

      44.935850648 seconds time elapsed
The perf record command can be used to sample a given set of performance counters at a given frequency, and is typically more useful in isolating performance hotspots in a program. For example, we can sample stalled cycles in Maya 2014 by running:
perf record -e stalled-cycles-frontend -F 1000 --call-graph -- M2014
The --call-graph argument is optional, and specifies that full stack traces should be recorded.
The results of perf record are written to a file called perf.data (unless specified otherwise). Whilst the file itself is difficult to parse by hand, the perf report tool provides a terminal-based interface for interactively visualising and navigating the results:
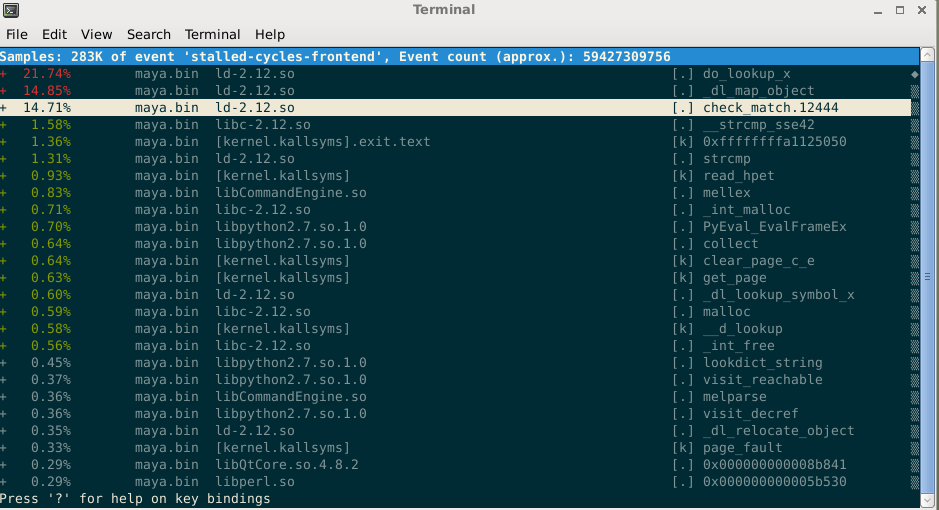
If stack traces are recorded, then the interface allows you to dive into the stack trace, and also zoom into the annotated source code if it can be found on the system.
It is also possible to perform a system-wide capture across all CPUs by using the perf record -a command (note that you need elevated privileges for this). For system-wide performance monitoring, the perf top command is also really useful - it provides a running sample of the most expensive processes and symbols, which is automatically refreshed at regular intervals.